Insights: Lessons Learnt From Our Carbon Footprint Assessment at UNGCNS
UNGCNS
23 May 2025
GCNS 2022 Carbon Footprint
Introduction
In line with global trends on increasing transparency and quality of carbon emissions reporting, we decided to increase the assessment of our 2022 emissions to include all Scope 3 emissions, such as Office Capital Purchases (Scope 3-2), and External GCNS Events and Training Workshops (various Scope 3 categories).
Our Emissions
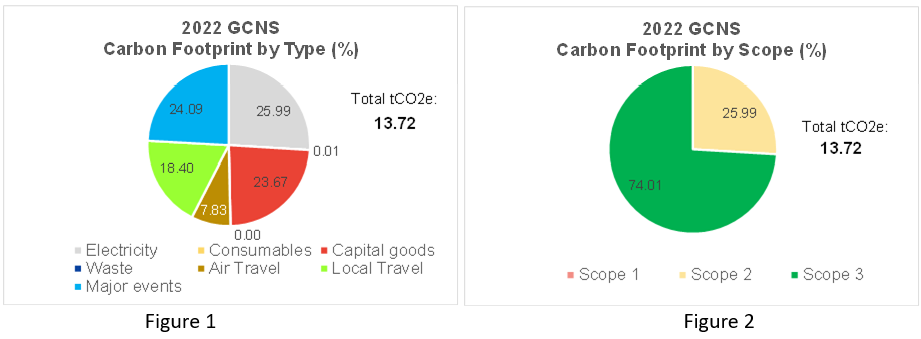
In 2022, the GCNS office and related activities generated a total of 13.7 tCO2e, as shown in Figure 1. For context, Singapore’s per capita annual carbon emissions is 8.3 tCO2e (2018, per NCCS/IEA). In other words, GCNS’s activities generate less than 2 person’s worth of emissions.
To align with GHG Protocol standards, GCNS’s carbon footprint was also classified according to Scope 1, 2 and 3, as shown in Figure 2.
If you are interested in the details of our carbon footprint, do check out our Carbon Footprint report which we published as a segment in our GCNS Annual Report 2022.
Lessons and Insights On Carbon Footprinting
Everything has to start somewhere, and a good carbon footprint is no different. Whilst we in CPLC Singapore have reached a level of experience to be in a position to footprint all 15 categories of Scope 3, in addition to Scope 1 and 2, we were not in such a position as recently as last year. If this is your first time doing a carbon footprint, start with easy first steps using a relatively easy-to-use tool such as our Carbon and Emissions Recording Tool (CERT), get going with whatever data you can get at the start, and gradually build up the quality of your footprint as you develop your expertise.
There is no such thing as an absolutely accurate carbon footprint. We realised quickly that every calculated emissions number will be an average or an estimate. Even the electricity grid emissions factor provided by the Energy Market Authority (EMA), (which is shown to 4 decimal places), is merely an average of the contributions by each power generator, and will not be exactly the emissions factor of the electricity consumed by you. Taking another example, you may not be able to get the local transportation data for each employee for the entire work year. It is therefore very acceptable to start with broad estimates (e.g. sample 10% of your workforce) and gradually sharpen your estimate as you go e.g. by increasing the sample size each year.
You may find that, at best, some of your colleagues will wonder what all this fuss is about carbon footprinting, and at worst, they may not cooperate with you when you need some necessary data from them. In such instances, see if the reason is that you may have asked for too much information that will take them a considerable amount of their time to dig out. If so, consider how you can simplify the data requirements, even if it is at the expense of less accuracy. It is better to get a rough estimate, than to have no estimates at all.
The CPLC Singapore team understands your dilemmas and difficulties as we have “been there, done that”. We are more than happy to assist you in any way we can. Do contact us at cplcsg@unglobalcompact.sg and we will see how we can help
 23 May 2025